
Critical Rendering Path: The Foundation of Web Performance [Part 1]
A practical guide to browser rendering, performance bottlenecks, and production optimisations.

Most frontend performance problems arise due to lack of understanding of how the browser renders a page. When you deeply understand this process, you stop guessing what’s going wrong? You know why a page is slow, which part of the rendering pipeline is expensive, and which optimisation will actually make a difference.
I've spent a fair amount of time debugging slow pages, improving Core Web Vitals, and chasing Lighthouse regressions. Almost every issue eventually led back to one thing: the browser's rendering pipeline.
This article is a deep dive into that pipeline and the techniques I've found useful while optimising production applications.
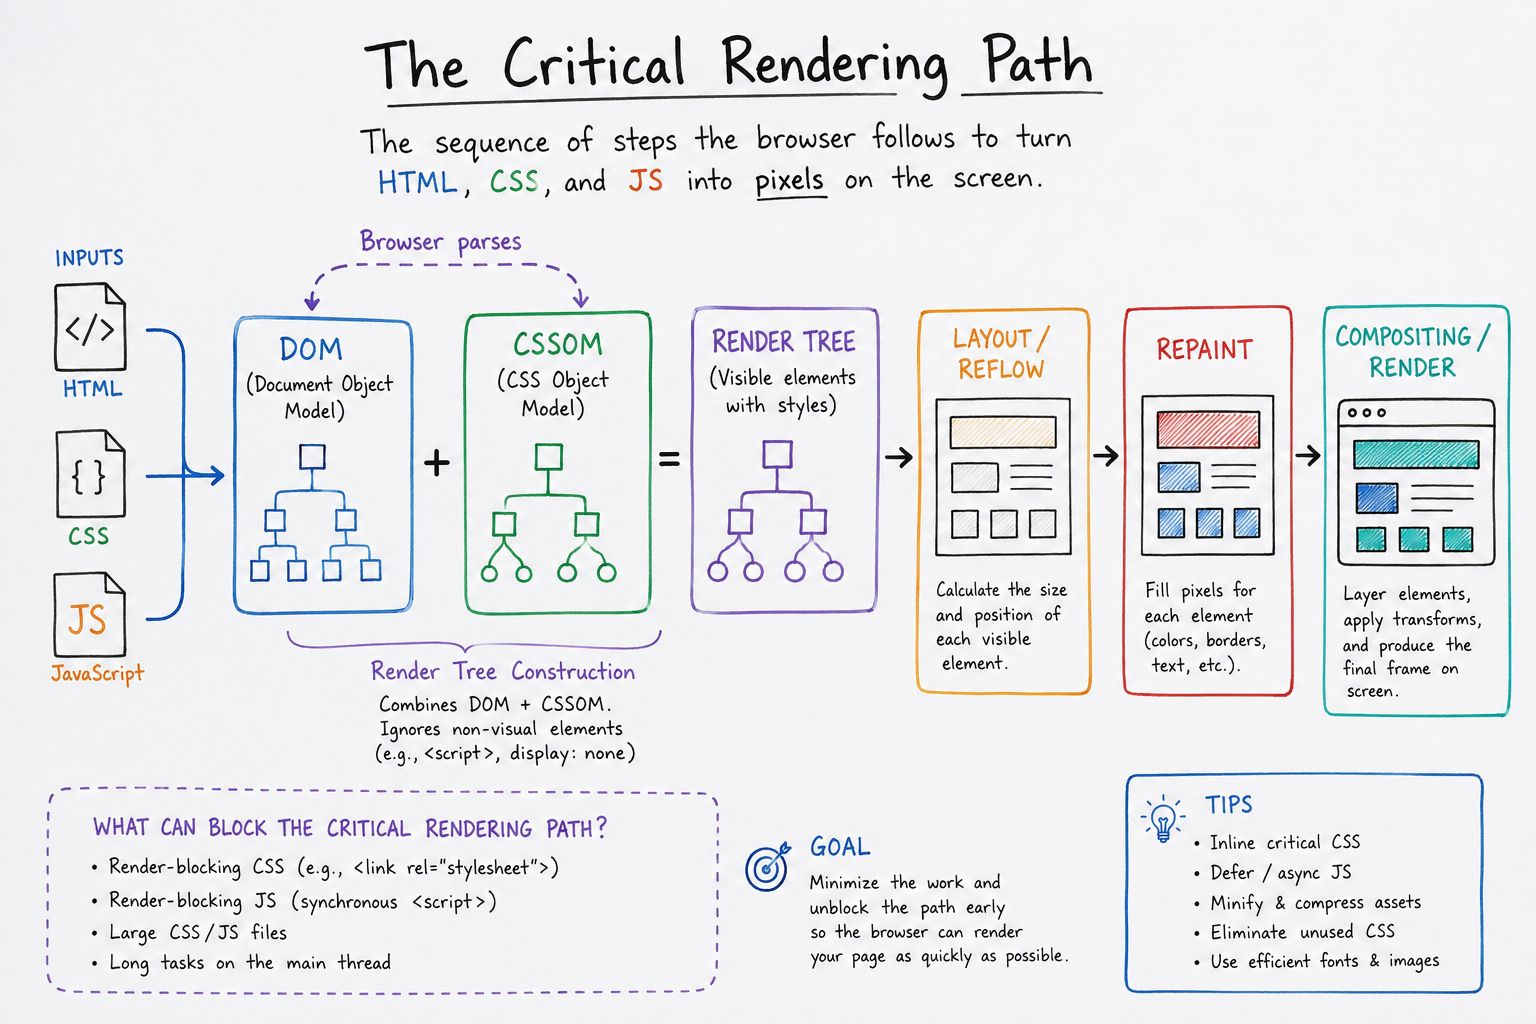
What is the Critical Rendering Path?
The Critical Rendering Path (CRP) is the sequence of steps the browser follows to convert HTML, CSS, and JavaScript into pixels on your screen.
The browser roughly performs the following steps:
Parse HTML → Build the DOM
Parse CSS → Build the CSSOM
Combine both → Build the Render Tree
Calculate Layout
Paint pixels
Composite layers and display the frame
Every optimisation you make ultimately reduces the cost of one of these stages.
Let's understand each step.
1. Parsing HTML → Building the DOM
Everything starts with the HTML document.
As the browser receives the HTML response, it immediately starts parsing it from top to bottom. It doesn’t wait for the entire document to be downloaded first.
Each HTML element is converted into a tree-like structure called the Document Object Model (DOM). The DOM represents the structure of your page.
While parsing the HTML, the browser also encounters other resources such as CSS and JavaScript. These influence the rendering pipeline differently, and understanding that difference is where most performance optimisations begin.
2. Parsing CSS → Building the CSSOM
Whenever the browser encounters a stylesheet, it starts downloading and parsing it into another tree-like structure called the CSS Object Model (CSSOM). This is a synchronous process.
CSSOM is necessary, because it tells the browser about the final appearance of an element. For example, a simple <button> could have styles defined by: the browser’s default stylesheet, your global CSS, a component stylesheet, a utility class, a media query, pseudo selectors like :hover
Until all applicable rules are resolved, the browser cannot accurately render that element. This is why CSS is render blocking. It is by Design.
Common bottlenecks
Large monolithic CSS bundles
Unused CSS shipped to every page
Multiple blocking stylesheets
Slow network requests
Common optimisations
Remove unused CSS during the build.
Minify and compress CSS (Brotli/Gzip).
Cache static assets using a CDN.
Inline only the critical above-the-fold CSS.
Load non-critical CSS asynchronously.
Split CSS by route, template, or component where appropriate.
The goal is always the same: reduce the amount of CSS the browser needs before it can render the first screen.
3. JavaScript and the HTML Parser
Unlike CSS, JavaScript doesn’t block rendering. By default, it blocks HTML parsing.
When the browser encounters a synchronous <script> tag, it pauses parsing the document, downloads the script, executes it, and only then continues parsing the remaining HTML.
Why? Because JavaScript can modify both the DOM and the CSSOM.
If the browser continued parsing while JavaScript was simultaneously changing the page, it could end up working with stale information.
Common bottlenecks
Large JavaScript bundles
Expensive script execution
Third-party scripts (like analytics)
Long-running tasks on the main thread
Common optimisations
Move non-critical scripts to the end of the document.
Use defer for application scripts.
Use async for independent scripts.
Lazy load code using route or component-based code splitting.
Break long tasks into smaller chunks.
Use Web Workers for CPU-intensive work.
Remove unnecessary polyfills.
Ship less JavaScript.
The fastest JavaScript is the JavaScript that never needs to be downloaded or executed. 😄
4. Building the Render Tree
By this point, the browser has built both the DOM and the CSSOM.
The next step is to combine them into a Render Tree.
The Render Tree contains only the elements that need to be rendered on the screen. Every node in the Render Tree contains both the structure (from the DOM) and the computed styles (from the CSSOM).
Not every DOM node becomes part of the Render Tree.
For example, elements with display: none are excluded because they don't participate in rendering. On the other hand, elements with visibility: hidden are included—they still occupy layout space even though they aren't visible.
Think of the Render Tree as the browser's blueprint for rendering the page. Only after this tree is ready can the browser determine where everything belongs.
5. Layout (Reflow)
Once the Render Tree has been created, the browser calculates the size and position of every visible element. This phase is called Layout, also known as Reflow.
The browser now answers questions like:
How wide should this element be?
How tall is it?
Where should it be positioned?
Does this text wrap onto the next line?
How much space does every element occupy?
Layout is one of the most expensive stages of the rendering pipeline because changing the size or position of one element can affect many others around it.
Imagine increasing the width of a parent container. Every child element may need to be repositioned, neighbouring elements may shift, and the browser may need to recalculate large parts of the page.
Common bottlenecks
Frequent DOM mutations
Reading layout properties (offsetWidth, clientHeight, getBoundingClientRect) immediately after modifying the DOM
Large, deeply nested layouts
Layout thrashing caused by alternating DOM reads and writes
Common optimisations
Batch DOM reads and writes.
Avoid unnecessary layout calculations.
Reduce unnecessary DOM complexity.
Debounce resize and scroll handlers where appropriate.
The less work the browser performs during Layout, the faster it can move to the next stage.
6. Paint (Repaint)
Once the browser knows where every element belongs, it starts painting pixels. This stage is called Paint (or Repaint if it’s happening after an update).
Changing purely visual properties often triggers a repaint without requiring another layout. For example, changing the background-color of a button usually doesn't affect the position of surrounding elements. The browser simply repaints that portion of the screen.
Common bottlenecks
Large repaint regions
Heavy visual effects like blur and complex shadows
Frequent repaint-triggering animations
Common optimisations
Keep repaint areas as small as possible.
Avoid animating paint-heavy properties where possible.
Prefer simpler visual effects on frequently updated elements.
7. Compositing
The final stage is Compositing. Modern browsers don't paint the entire page as one giant image. Instead, they split parts of the page into separate layers.
During compositing, these layers are combined to produce the final frame displayed on the screen.
This is one of the reasons why properties like transform and opacity are preferred for animations.
Changing these properties usually allows the browser to skip Layout and Paint entirely. It only needs to update the composited layer, which is significantly cheaper and often GPU accelerated.
This is why you'll frequently hear the advice:
Animate transform and opacity, not top, left, width, or height.
Changing layout properties often forces the browser to go through Layout → Paint → Compositing again. Changing composited properties usually skips straight to the final stage.
Common optimisations
Animate transform and opacity
Avoid animating layout-affecting properties.
Use will-change sparingly to hint layer promotion when necessary.
Modern Browsers Are Smarter Than This
The rendering pipeline we've discussed is the conceptual model.
Modern browsers employ several optimisations to improve perceived performance and reduce unnecessary work.
Some of these include:
Speculative parsing, where the browser discovers and starts downloading resources before the HTML parser reaches them.
Incremental rendering, where parts of the page are painted as soon as sufficient information is available instead of waiting for the entire document.
Parallel resource fetching, allowing multiple assets to download simultaneously.
GPU compositing, which offloads suitable rendering work to the graphics processor.
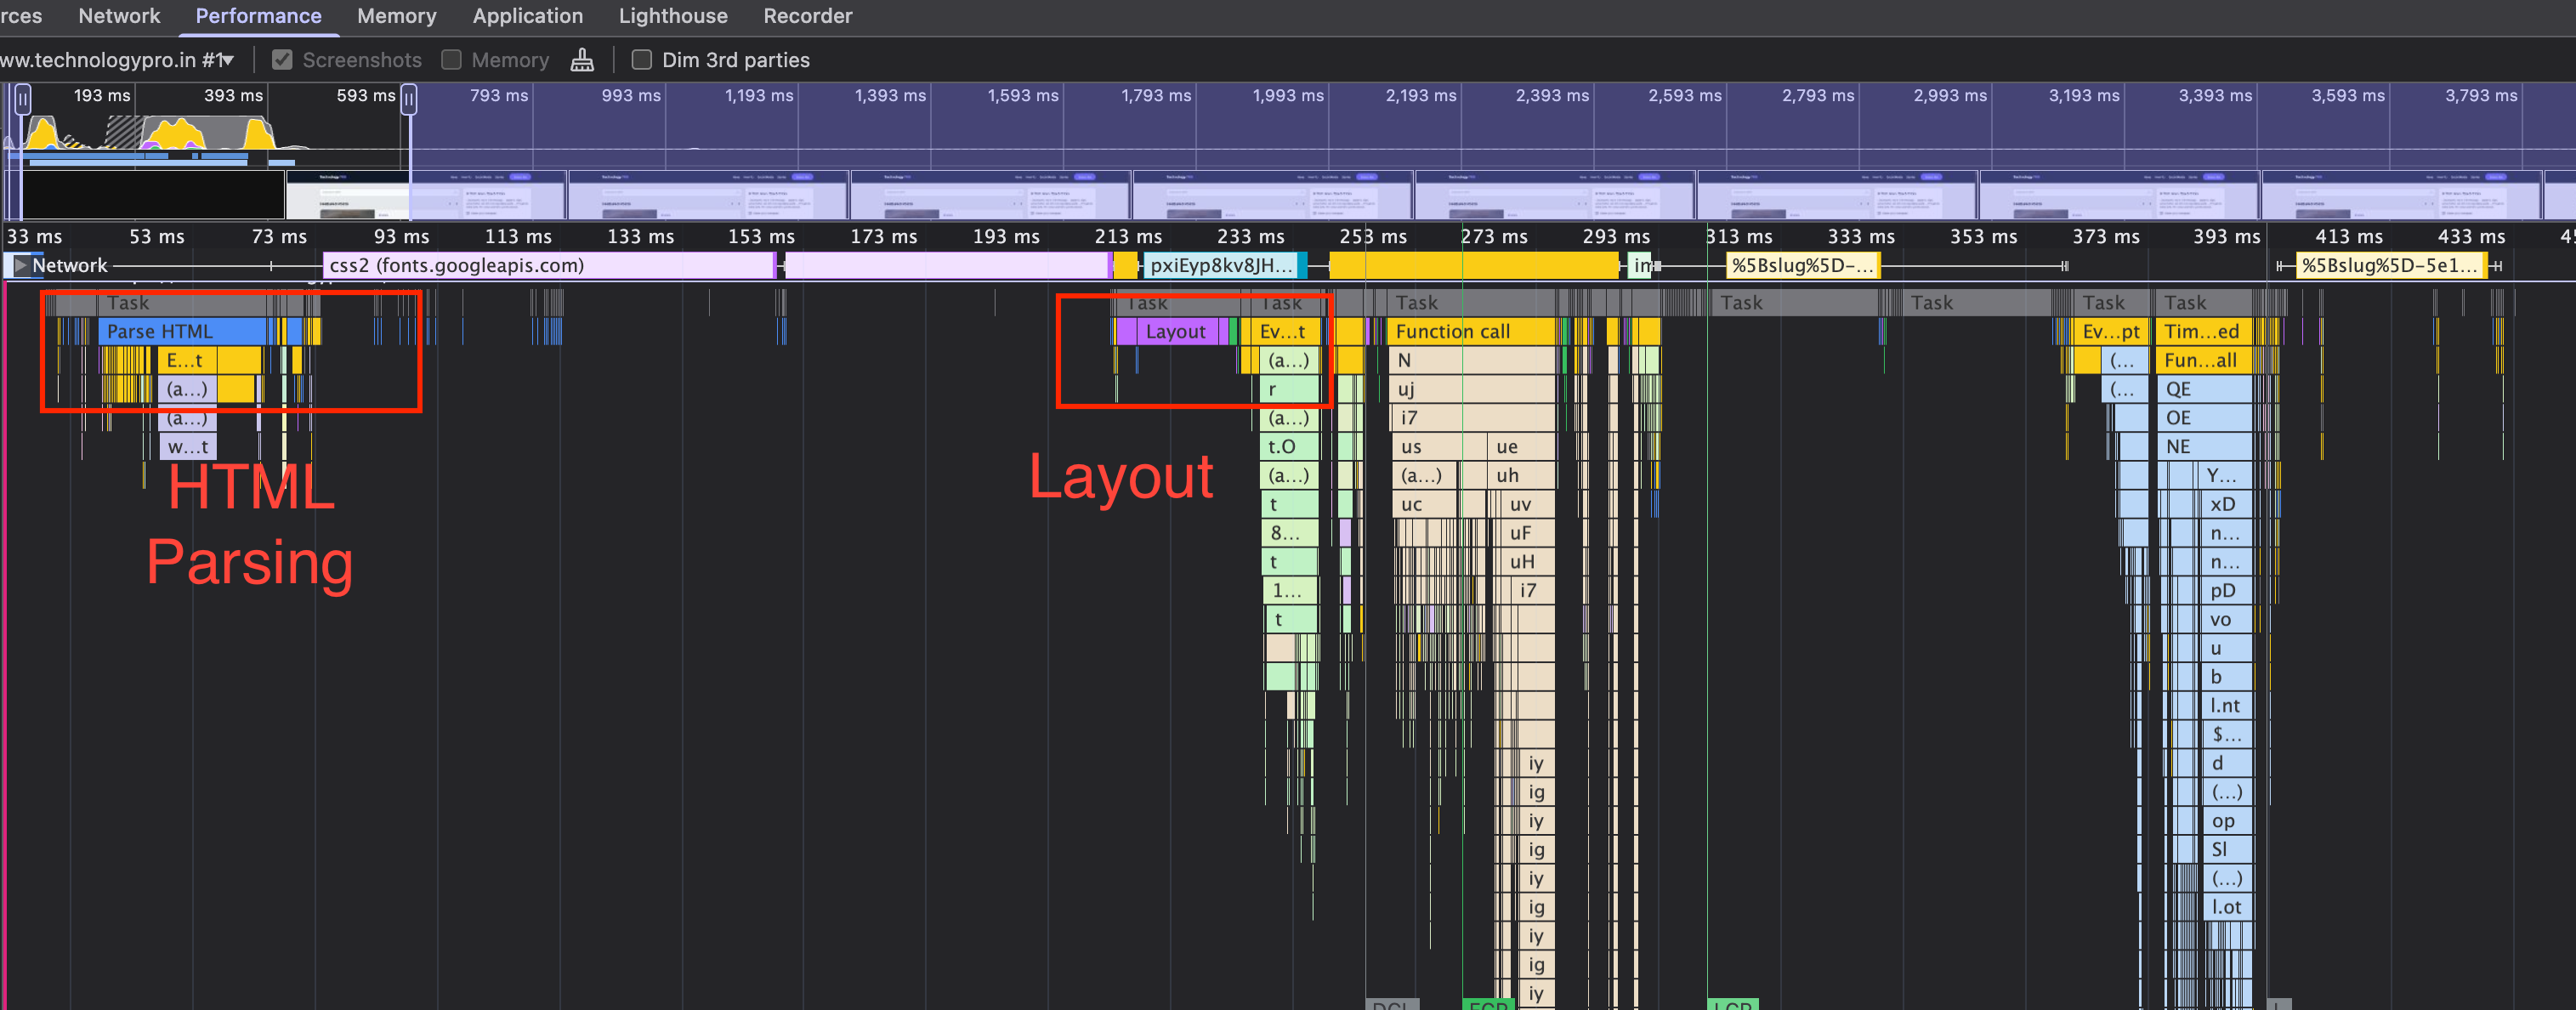
If you record a page load in Chrome DevTools' Performance panel, you'll notice that these stages often overlap. Real browsers optimise aggressively, but the underlying concepts remain exactly the same.
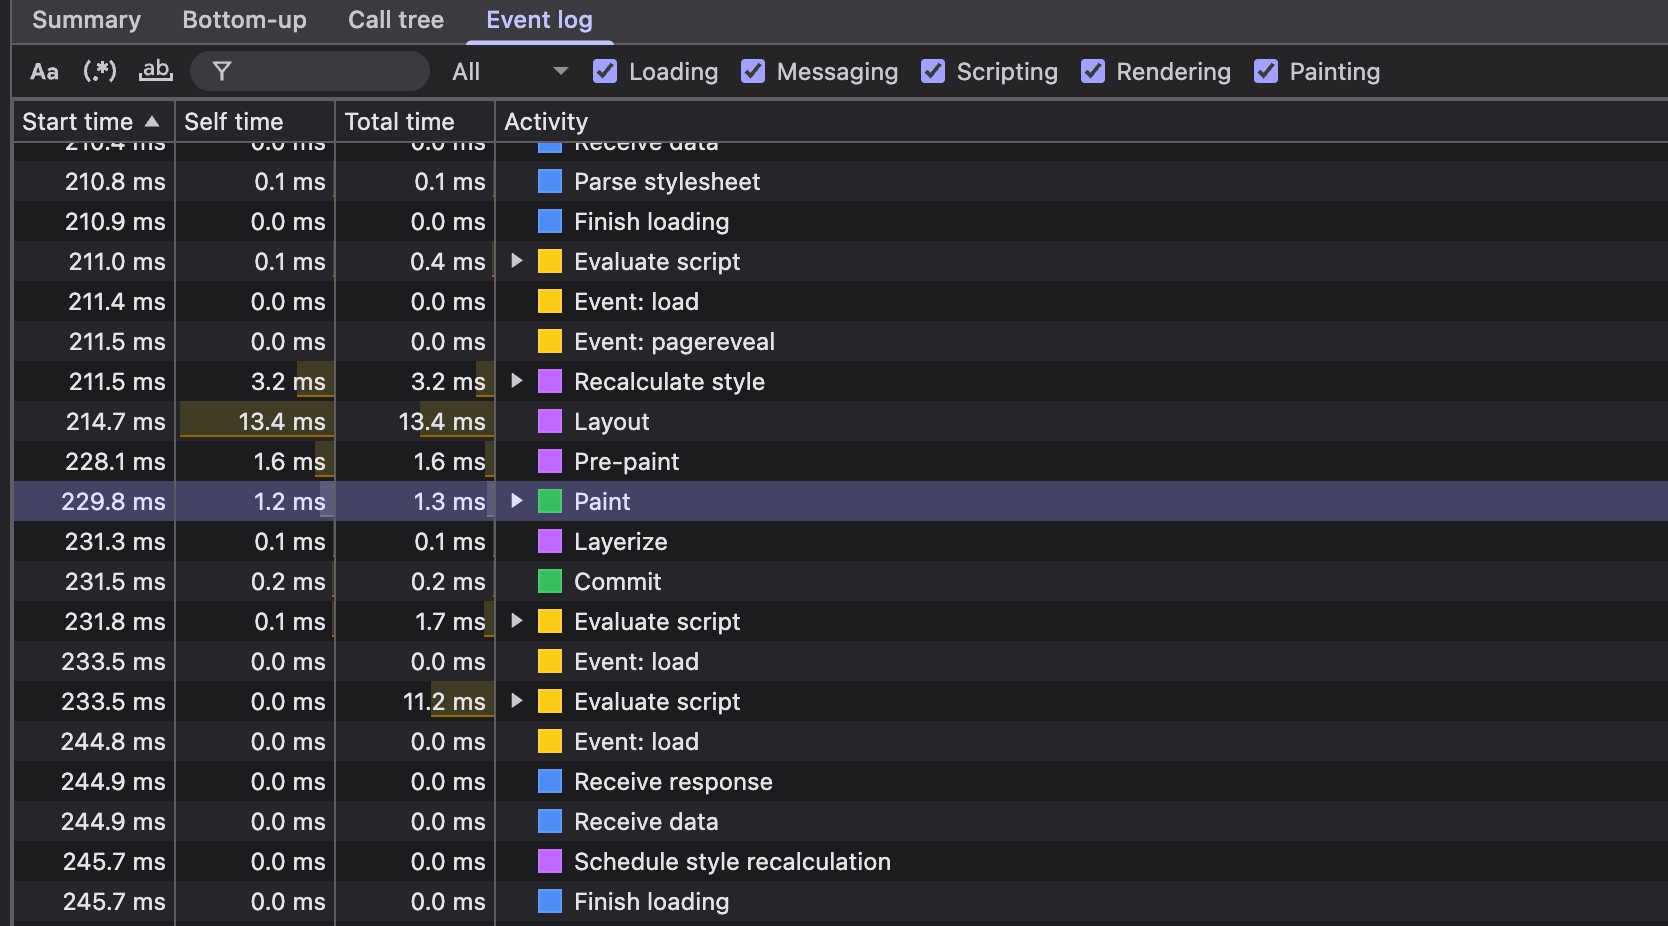
Understanding the conceptual pipeline makes it much easier to reason about performance issues, regardless of the browser's implementation details.
Mental Model
Every frontend performance optimisation reduces one of these costs:
Download less.
Parse less.
Execute less.
Layout less.
Paint less.
Composite whenever possible.
Whenever I encounter a performance issue, I try to answer one question first:
Which stage of the rendering pipeline is expensive?
Once that becomes clear, the optimisation usually becomes obvious.
Wrapping Up
The Critical Rendering Path is one of those topics that keeps paying dividends throughout our frontend career. Every senior frontend developer must know it.
Whether you’re investigating a poor Lighthouse score, debugging a slow page load, improving Core Web Vitals, or reviewing a pull request, understanding how the browser renders a page gives you a much stronger intuition than relying on optimisation checklists.
This mental model has helped me reason about performance problems far more effectively than chasing individual Lighthouse recommendations.
In Part 2, we’ll move beyond theory and look at real-world case studies—from render-blocking CSS and JavaScript to layout thrashing, image optimisation, compositing, and the techniques I’ve used to improve web performance in production.
Until then, happy rendering. 🚀